Benchmarking of dialysis treatment
There are more than 700 dialysis facilities in Germany. Apart from the quarterly QA reports currently created by the IQTIG, each facility receives benchmark reports provided by five reporting bodies, each of them covering their data supplying facilities.
The BERST interface
The National Association of Statutory Health Insurance Physicians (Kassenärztliche Bundesvereinigung, KBV) has created a standard interface for all data transfers between dialysis facilities and the reporting bodies. A multi-level encryption model has been implemented to ensure a particularly high level of security in data transmissions. Furthermore, a trust authority (VST, according to §299 SGB V) is inserted, which ensures the removal of personal identification data from the transmissions and the replacement of personal lifetime insurance numbers by untraceable pseudonyms.
The annual report
At the end of each year, all data flows from the five reporting bodies to Medical Netcare. Then, data is checked, bundled and incorporated into the annual benchmark report by Medical Netcare within only 3 months .
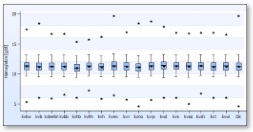
The report covers the evaluation of all laboratory values transmitted by the dialysis facilities. Usually, data is presented in two ways:
- a comparison of the range of measured values in the 17 federal states of Germany (boxplot graph)
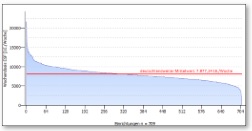
- a comparison of arithmetic means of measured values in each facility (benchmark graph)
The presentation in a boxplot allows to detect regional outliers at a glance. In addition, a plot for all of Germany is given.
In contrast, the benchmark chart shows the mean values within each facilitiy (every facilitiy is represented by a bar) as well as the nationwide arithmetic mean (presented as a red line). The distribution of means around the nationwide mean appears clearly in this way.
Both charts can also provide information about basic problems, such as incorrect conversion factors during data export or possible input errors (showing very high maximum values, for example).
Download our annual reports
Following the submission of an annual report, it is generally released by the Federal Joint Committee (G-BA) within 3 to 4 months. We will be making each report available for download as soon as possible. All MNC reports released up until now can be found below.
In addition, we linked two documents by the Federal Joint Committee (G-BA), the "patient information on Quality Assurance across institutions", a fact sheet, as well as a data flow model (both in German language).